Finally, Tracing in PHP — Say Hello to OpenTelemetry
Finally PHP receives production ready tooling for tracking business flows, communication between Services, errors and performance.

Profiling leads the way in PHP to verify performance of our applications. Yet when we want to track flows and communication within our system we need something more. We need a way to trace requests between Services, we need a way to trace Messages flows, and where the communication has failed or stopped.
And finally, we have official tooling in PHP to do. Let’s hello to OpenTelemetry.
OpenTelemetry
OpenTelemetry is connection of two big standards and tracing frameworks OpenTracing and OpenCensus projects. The leadership of those two projects have came together to create OpenTelemetry, which combines the best parts of both.
OpenTracing and OpenCensus will not longer be maintained, they are considered archived now. So, if you want to integrate tracing within your system, consider OpenTelemetry instead.
OpenTelemetry allows us to trace the flows within the system, how much time do they take, what’s happening during the flow, and help us visualize those flows using 3rd part tooling.
We can summary it as a high level overview of what the system does, which can be used for observing, tracing and monitoring of our system.
Thanks to OpenTelemetry we are not bound to given Tracing provider. We may choose one of different tracing providers (e.g. DataDog, Zipkin, Jaeger) which integrates with OpenTelemetry specification. Therefore we can switch and choose whatever feel best in context of our system.
In PHP we often had unofficial integrations with 3rd party or implementation of standards that were not stable, yet with OpenTelemetry it’s different. The integration is official implementation of the standard in PHP and was verified by OpenTelemetry team.
At the end September 2023, PHP implementation of OpenTelemetry was released under stable 1.0.0 version.
Auto-Instrumentation
OpenTelemetry provides few amazing features, and of them is Auto-Instrumentation. Auto-Instrumentation provides hook mechanism, which will trace whatever we would like to verify, without changing single line of code. This way we can add tracing to basically all applications, no matter if they are legacy or new projects.
There are different packages using Auto-Instrumentation already available, which provides hook mechanism for things like database calls, http calls, symfony/laravel requests etc.
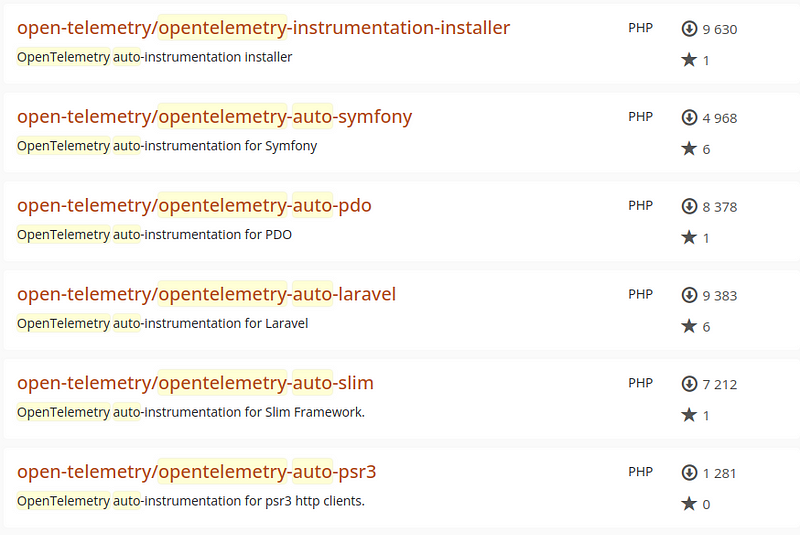
Auto-Instrumentation is installed via PHP extension. After extension is installed, we may choose different auto-instrumentation package, install it, and voilà tracing enabled.
Of course we may add our own hooks using simple interface from OpenTelemetry\Instrumentation\hook, by simply providing a class and method, which we would like to trace:
If you want to build your own auto-instrumentation package, you will find step by step instruction here.
Production Optimization
Doing tracing on the production is huge thing, as this the environment where we mostly face problems which locally do not exists. More amount of data, real life integrations, application issues that we need to debug, it all happens on the production.
The problem is that traces needs to be sent outside and this cost time. If we send to some external Service over network, we will pay in time for that and with lack of multi-threading in PHP, it means the whole PHP process will pay that price.
OpenTelemetry introduces Collector concept, which sits together with your Application as form of a side-car, so you can send traces to optimized Agent within your network.
Collector works as a proxy, which collects the logs and sends it to the 3rd party of your choice, for example DataDog.
This happens over GRPC with Protobuf for performance, and as we host the Agent (Collector) within our own network, it becomes really efficient solution for sending traces quickly within production environment.
Tracing Message-Driven Architecture
System with complex business flows and Messaging Architecture, can benefit greatly from Tracing. As OpenTelemetry provides overview of what is happening within our system and together with 3rd party integration like Jaeger/DataDog we can visualize how our flows looks like.
And this is why I’ve integrated Ecotone Framework with OpenTelemetry, to make use of this benefits.
We will now explore how this integration looks using real life examples and how can we benefit from it. Yet before we will do it, let’s quickly understand the main concepts behind OpenTelemetry.
OpenTelemetry Concepts
There is one main concept in OpenTelemetry, which is called Span.
Span — Span is concept which represent given unit of work, which can be measured in time. That can be a database call, http call or simply your HTTP Request. Spans can references each other, for example HTTP Request Span may contain of database calls as a child span.
Span Context- Represents context of given span, like it’s own unique identifier — Span Id, parent id which references to parent Span etc.
Trace — Connects spans under same measuring unit. All Span Contexts hold reference to Trace using identifier.
That’s basically enough knowledge to jump into real life examples.
Tracing Flows
Ecotone will trace your flows for Command/Query/Event Handlers and Buses. This is nice way to see, how our flows are connected and what are the side effects of triggering given action.
Each Message Handler will receive a separate span, this way we can isolate and research particular part of the flow separately.
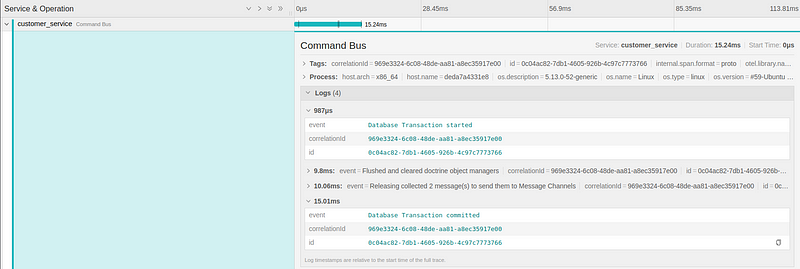
Within each Span, Ecotone provide so called OpenTelemetry Events. Events are no more than basic logs, which provide details of what’s happening within given Span. For Command Bus it could be information about Middlewares it started like Database Transaction.
Tracing Asynchronous Flows
In case of asynchronous flows, there is a need to pass the Span Context between processes. This way OpenTelemetry knows what was the parent Span that caused that.
Ecotone will propagate Tracing Context automatically, when asynchronous Messages are sent. This is done via Message Headers and is done on the Framework level, so Application level code does not need to be aware of this.
Adding Auto-Instrumentation Package
We were mentioning about Auto-Instrumentation Packages, so let’s see how it works in practice. Suppose we want to start tracing Database queries as we would like to know what kind of SQLs are happening and how much time they take.
When Auto-Instrumentation is configured, installation of auto-packages becomes trivial, as all we need to do is to require composer package:
composer require open-telemetry/opentelemetry-auto-pdo
Voilà, we now trace Database Queries. Whatever SQLs happen on the application level, inside framework or any libraries we use, we will track them now. Nothing will hide from us :)
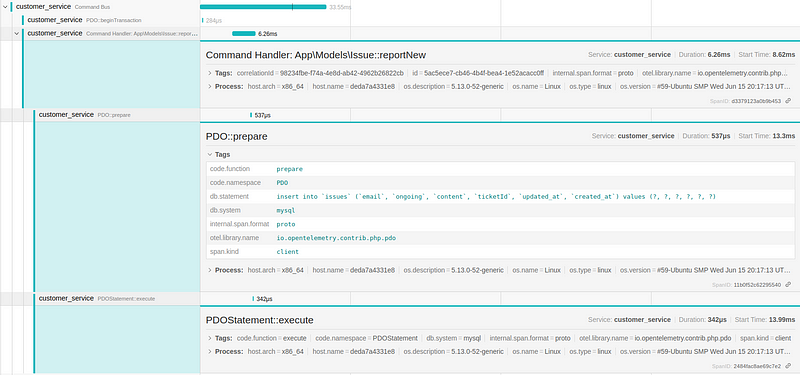
As you can see in previous photo, our flow starts when we call Command Bus. This is not fully accurate, as it actually starts with HTTP Request. However using Auto-Instrumentation for Laravel or Symfony, we can fix that, and start traces earlier:
composer require open-telemetry/opentelemetry-auto-laravel
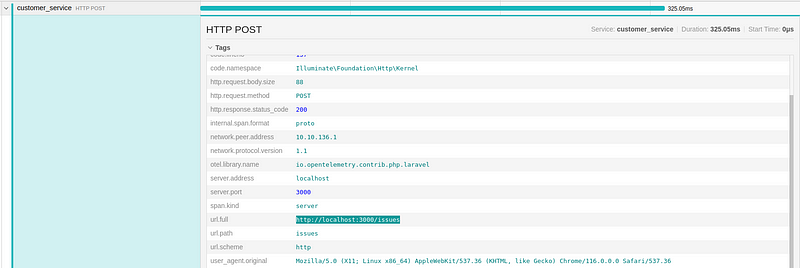
Right now we get much more details on what is the overall time of the request, as the tracing starts, when the request handling starts.
Tracing Issues
We may have situation where Customer will not receive an email or his payment will not be recorded due to bug in the system. To find out Traces that may help us debug the problem, we will use native Ecotone functionality which propagates metadata within the flow.
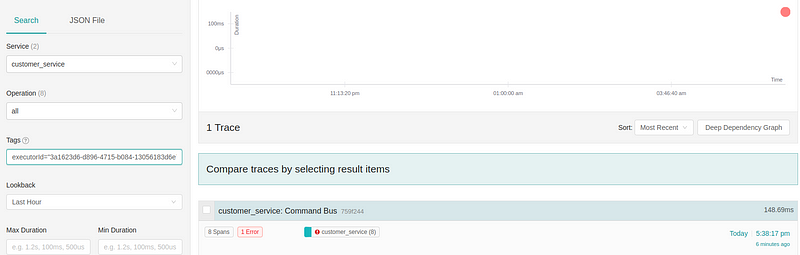
So in here we are sending an Command via Command Bus and provide executorId within Metadata. This will be automatically propagated to all the Events that happens as a result of this Command, and related asynchronous flows.
Ecotone propagates Metadata to OpenTelemetry in form of Attributes, therefore we can make use of it for searching related traces. We know that executorId will be id of Customer that faced the issue, so we may use it for lookup.
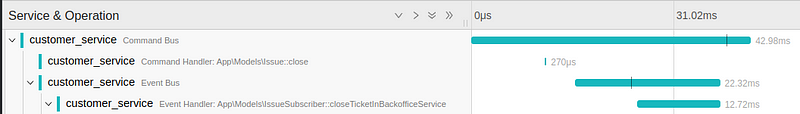
We’ve identified failed trace using executorId and now we can take a look, what happened as Exception and failed Message is available within the Trace.
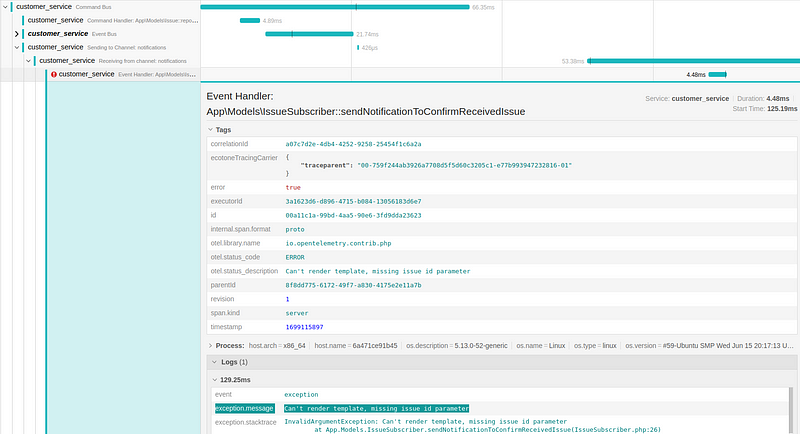
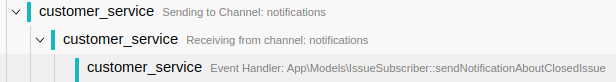
As we can see our Asynchronous Event Handler have failed, while sending Notification. We can clearly see, that previous part of the flow was successful, only the part where notification was sent has failed.
Within the trace we’ve all the needed information like exception message, stacktrace, metadata, so it’s easy to understand what and how it failed.
Tracing using Message Identifiers
In Ecotone all Messages contains of Message Id, Correlation Id and Parent Id within Metadata. Those are automatically assigned and propagated by the Framework, so from application level code we don’t need to deal with those Messaging Concepts.
This of course open possibilities, as we can make use of those Identifiers to lookup related traces:
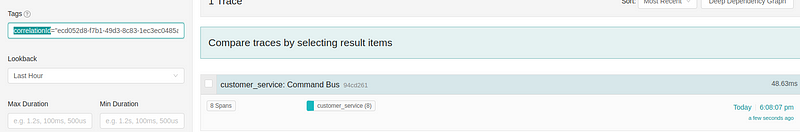
Lookup using Message Id, Correlation Id are especially useful when we are interested in concrete flow, as it will give us more accurate results which are correlated with specific Message. This will help us find out what have happened during the flow and if any part of the flow has failed.
Ecotone’s Event Sourcing Module stores all the metadata in the Event Stream. This becomes very handy if something should happened but did not. As we can use of Correlation Id or Message Id, to check what happened during the flow.
Cross Service Communication
If we have more than one Service (Application), we would like to have possibility to lookup traces from single place instead of jumping between different instances of Zipkin or Jaeger. Lucky OpenTelemetry does understand concept of different Services, therefore we may push traces with information about Service it belongs to.
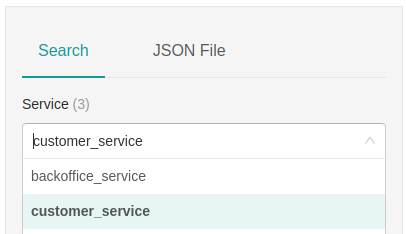
We can filter specific trace for specific Service, yet the real power is achieved when we can combine them.
Ecotone provides Distributed Bus for communication between Services., which handles Pub-Sub (Event Communication) or Direct (Command Communication). Whenever we are using Distributed Bus to send Message to different Service, Ecotone will take care of Span Context propagation. This way traces will be correlated together:
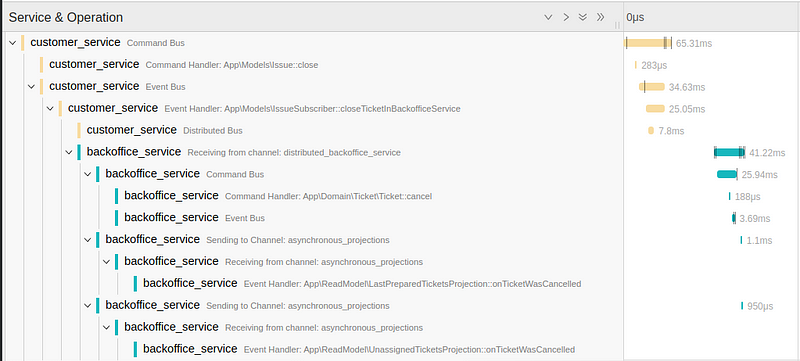
As you can see traces have been combined together. We can clearly see how flow have started within Customer Service and then have moved to BackOffice Service, after calling Distributed Bus.
This way we get high level overview of everything what is happening with our system, no matter if this is Single Service or Microservice architecture.
To play around with real life OpenTelemetry integration together with Ecotone and either Symfony or Laravel, visit this repository.
Summary
In PHP we often had unofficial integrations with 3rd parties, or implementation of standards that were not official or always in beta phase, yet with OpenTelemetry it’s different. The integration is official implementation of the standard in PHP and verified by OpenTelemetry team. And starting from the end of September 2023 confirmed to be stable with 1.0.0 version release.
OpenTelemetry is a powerful toolkit that can help save hours of debugging and provide clear overview on how the system responds and behaves. It also becomes much easier to onboard new developers, as they may run Tracing locally. This helps in understanding the flows quicker, and makes people used to debugging problems the same way it happens on production.
So it’s worth to say thank you to Brett McBride, Przemek Delewski,
Bob Strecansky and everyone else involved in making this happen.
The value OpenTelemetry brings to development is huge, and by joining it with proper Messaging Architecture, it becomes a gamer changer for PHP.